Writing a Custom Map-State for Storm Trident

One of Storm’s common uses is in doing real-time ETL – where a topology performs some processing on a stream and persists state to an external data store. Often, the state being stored is a map-state, where we perform a grouping and aggregation on the stream and keep track of the results in a map-like data structure. An example of this would be consuming a stream of page visits, splitting the stream by user ID and performing a count operation – maintaining a map containing a real-time count of the number of pages each user has visited.

When using Storm, there is a choice to make around whether to use core Storm or Storm Trident. Trident is an abstraction on top of Storm which adds some additional capabilities (and complexity). The additional complexity means that for performance-critical applications, Trident is usually not a suitable choice – however there are a few good reasons to choose Trident:

  • Trident takes a micro-batching approach to stream processing, meaning we can make use of optimisations involving bulk reads and writes to external data stores.
  • Trident has built in abstractions for maintaining state in a fault-tolerant way. We could implement our own way of maintaining state on top of core Storm, but Trident provides this out-of-the-box.
  • The state abstractions support maintaining different types of state, such as transactional or opaque (discussed later). This is good when you need exactly-once tuple processing or guarantees beyond core Storm’s at-least-once guarantee.
  • Trident provides a nice API on top of Storm, for partitioning streams, performing aggregations and groupings, and persisting state.

Here’s what our earlier example might look like, as a Storm Trident topology:

An interesting part of the Trident API is how state is persisted, via the call to persistentAggregate. In the example above, we instruct Trident to perform an aggregation on the stream – counting the number of tuples for each userId and store the results.

There are three arguments to persistentAggregate:

  • A state implementation – a class that acts as a factory for building Trident states. In the example, the call to persistentAggregate comes immediately after a groupBy operation. Trident recognises that we are operating on a grouped stream and therefore expects a state implementation that implements the MapState interface.
  • An aggregator – in this case Count. The aggregator simply defines a state to assign to every observed tuple (in this case, 1) and a function for combining two states (in this case, performing addition).
  • Output fields – if a new stream is derived from the aggregation, the values of the state are output as a tuple with the fields defined here. In our example, the count aggregator produces a count, so we output this as a single field, count. Since we are operating on a grouped stream, the output tuples in the derived stream will contain two fields: userId and count

Trident is often demonstrated with the MemoryMapState – a map-state implementation which stores all state in memory. In practice, you usually want to persist state to a non-volatile, fault-tolerant store. If your choice of data store doesn’t already have a Trident state implementation, you may have to write one yourself. The rest of this post will show what’s required to write your own Trident map-state, with examples from a map-state implementation that I wrote for Aerospike, a distributed key-value store.

Most map-state implementations in Trident provide three ways to store and update state, each of which yields different processing guarantees:

  • Non-transactional – No processing guarantee. In this case the map-state will store only the latest result for each key, for example a count.
  • Transactional – Exactly once processing guarantee, as long as the spout is also transactional. This means that the spout guarantees that every tuple appears in exactly one batch, and two batches with the same ID will always contain the same tuples. In this case the map-state will store the latest result for each key, along with a batch ID corresponding to the batch of the most recent update.
  • Opaque – Exactly once processing guarantee, as long as the spout is also opaque. This means that the spout guarantees that every tuple is processed at least once, although a tuple may fail in one batch and then succeed in a later batch. In this case the map-state will store the latest result for each key, a batch ID corresponding to the batch of the most recent update and finally the previous value for the key.

Of course, transactional or opaque states are usually desirable, as they can provide exactly-once processing guarantees. They store additional information for each key, so the tradeoff comes with using more space. The fault-tolerance logic for these three types of map-state are the same for any implementation and Trident conveniently provides wrapper classes for each, which will wrap an underlying backing map with the fault-tolerance mechanics. We just need to implement the IBackingMap interface, and provide the logic for doing batch reads and writes to our underlying datastore. Here’s how this might look:

In this example I’ve wrapped the backing map with Trident’s CachedMap implementation, which caches writes in-memory. This improves read performance and reduces load on our underlying data store, especially if it is likely that the same key will be updated multiple times within a short time period.

Implementing the multiGet and multiPut methods of IBackingMap is where the bulk of our logic goes. This is where we write our custom logic to interact with our underlying data store and perform batch reads and writes. Typically, multiPut would iterate over the keys in the batch, construct a batch write request, and finally perform a batch write. In my case, Aerospike does not support batch writes, so I had to perform a write for every key:

The last piece is to define a way serialize the values to and from your underlying data store. Note the reference to serializerHelper above – this helper contains functions to map between Trident values and values that the Aerospike client expects. I wrote a serializer for non-transactional, transactional and opaque states, which define mappings for Object, Trident’s TransactionalValue, and Trident’s OpaqueValue respectively:

That’s it – we are now ready to try out our new state implementation. In summary, the steps we followed were:

  1. Implement IBackingMap to do multiGets and multiPuts to the underlying data store
  2. Write serializers for each of the three state value types
  3. Wrap our IBackingMap implementation with one of Trident’s map implementations, providing the appropriate serializer

Trident will handle the tricky fault-tolerance logic, and we can sit back and enjoy the processing guarantees 🙂
Modern Database Access with Scala and Slick

Over the last few weeks I have been writing my first Scala application – a RESTful service backed by a SQL database for persistent storage. After some googling around the ‘Scala way’ to interact with a SQL database, I came across a modern database access library for Scala, called Slick.

Slick is a really clever library. Not only does it provide you with a way to perform operations on database tables by writing familiar Scala code – in the same way that you would perform operations on Scala collections – but, it also lets you do this in a type-safe way. Effectively, Slick is compiling Scala code to SQL. Consider a simple SQL query which selects a row by ID:

With Slick, we can use the familiar filter and map methods to write this query – it’s just like we are using the Scala collections API:

There is a key difference – if users were a normal Scala collection, then we would probably observe that _.userId has type Int, the literal 10 has type Int and _.username has type String. But here, users is not a Scala collection, it is an instance of a Slick table query. And we don’t actually have Ints and Strings to use in our filters and maps, since we are building a query that has not yet been executed. So what types are we actually using?

To achieve type safety, behind the scenes Slick is ‘lifting’ types into its own parameterised type, called Rep. From our table model, Slick knows that the userId column stores integers, so the type of _.userId is Rep[Int]. This can be read ‘representation of Int’. Since the === function on Rep[Int] expects another Rep[Int], an implicit function is used to ‘lift’ the plain literal 10 into a Rep[Int]. If we try to compare _.userId with something that cannot be converted into a Rep[Int], then the compiler will complain. This is how Slick provides a type safe DSL for writing database queries. Similarly, the type of the username column has type Rep[String] and so if we run this query we will get back a result of type String.

This really demonstrates the power and extensibility of the Scala language, as it simply isn’t possible to achieve the same thing in other languages. Something similar has been done before by Microsoft, with LINQ for C#. However, Microsoft didn’t achieve LINQ by using the C# language itself; they had to build the functionality into the C# compiler.

While this feature of Slick really stands out, there are many other reasons to use the library:

  • Full support for all popular SQL implementations
  • Handling of sessions and transactions. You can plugin a connection pool implementation such as HikariCP
  • Protection against SQL injection. When using plain SQL, all parameters are converted to SQL bind/substitution variables
  • An asynchronous API for performing database operations

The asynchronous API has been introduced very recently in Slick 3 and has seen Slick move away from a blocking API and instead towards an API which leverages Scala futures. This was perfect for my application, a RESTful web service written on top of Spray – a toolkit for building services based on REST/HTTP. A Future[Response] could be returned back to my request handling logic and Spray’s in-built marshaller for futures will delay marshalling until the response becomes available, at which point it can be marshalled by another thread.

As you might expect, with Slick you can build more complex queries or sequences of database operations using Scala’s for-yield construct. It turns out there are a few ways to do this – you can build queries by composing in either Query, DBIOAction or Future itself and at first I wasn’t sure when to use one over the other.

Composing in Query
When you compose in Query, Slick generates just one SQL statement. For this reason, this approach should be used wherever possible. In the example below, we perform a (implicit) join between a users and purchases table to find all purchases for a specific user.

Composing in DBIOAction
In Slick, a DBIOAction corresponds to a single database operation. Composing in DBIOAction results in multiple SQL statements, but just one database connection is used to execute them. This is particularly good if you have a sequence of dependent database operations that you want to execute transactionally. You can compose in DBIOAction and use Slick’s .transactionally method to execute the queries in a single transaction. This means that if any one of the queries fails, all prior operations will be rolled back – leaving the database in a consistent state. In the example below, we insert a user and then use the ID returned by this insert operation to insert a sequence of purchases, all in a single transaction.

Composing in Future
With this approach, Slick obtains a connection from the connection pool for each statement, so potentially multiple connections are used. Therefore, composing in Future should only be done if absolutely necessary. In the example below, we perform the same inserts as above. Note that here, it’s not possible to execute the two operations transactionally and a different database connection may be used for each operation. The only real reason to compose in Future would be in the unlikely case that you need to perform some non-Slick related operation in-between the database operations.

In conclusion, with Query resulting in a single SQL statement and DBIOAction resulting in a single connection, for optimal execution prefer Query over DBIOAction over Future.

Like all good things, Slick has some limitations – perhaps the biggest drawback is the lack of control you have over how Slick generates SQL queries from your Scala code. There are cases where Slick fails to generate the most optimal SQL and as a result the query performance will be worse than if you’d just written the SQL yourself. So when query performance is critical, there may be times where it is better to avoid Slick’s SQL generation functionality. Running Slick in debug mode enables you to see the SQL that is being executed, so if you hit a performance issue it is easy to find out whether Slick is the cause. Another limitation I came across is that some queries are currently not expressible with Slick’s Scala abstractions. For example, this fairly common SQL query cannot be expressed in the current release of Slick:

UPDATE table SET field = field + 123

This example is an exception, as the vast majority of common SQL queries can be expressed very easily. The library is still undergoing rapid development, so issues like these are becoming increasingly less common. In cases where it is not possible to correctly express the operation you want to perform using Slick’s abstractions, you can always use Slick’s plain SQL API.

Cross Datacenter Mirroring with Kafka

Having recently began working for one of Europe’s leading online ad-tech providers, I have been involved in the configuration of a new high-load Kafka cluster with the aim of handling up to 300K messages/second. It really is a high-load requirement – as even LinkedIn, the original developers of Kafka are processing a lower volume, at around 100K messages/second.

One of the choices we faced in setting up the new cluster was centered around how to publish messages from various datacenters around the world. We could either publish to a single Kafka cluster, located in our main datacenter, or we could have a separate Kafka cluster in each region. The network connection between datacenters is slow and potentially unreliable, so it didn’t make sense to publish to a single Kafka cluster from anywhere in the world as there would be a considerable risk of data-loss. For this reason, we wanted to have a separate, local Kafka cluster within each region, but ultimately would need all data to be pushed to our main cluster. In fact, Kafka ships with a tool designed specifically for this purpose – to replicate Kafka topics from one cluster to another. Note that this is not the usual subject of replication in relation to Kafka, which refers to maintaining replicas of Kafka topics within a single cluster for fault-tolerance.

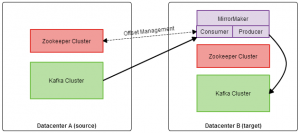
The MirrorMaker tool consists of a consumer and producer. For fault tolerance, multiple MirrorMaker processes can be fired up for the same mirroring task, within the same consumer group. If one fails, consumer re-balancing will take place as usual. The diagram below shows the full picture.

Mirroring data between two Kafka clusters

Starting a MirrorMaker process is simple; run the following command from the Kafka installation directory:

bin/kafka-run-class.sh kafka.tools.MirrorMaker --consumer.config config/consumer_source_cluster.properties --producer.config config/producer_target_cluster.properties --whitelist mytopic --num.producers 2 --num.streams 4

Here, the number of consumer and producer threads are specified by the num.streams and num.producers parameters respectively. One thing worth mentioning here is that the topic list parameter accepts a string in the format of a Java regex, so it’s possible to specify topic names with wildcards.

Confirming that the MirrorMaker is keeping up with the volume of messages in the source cluster’s topics can be done by running the built in offset checker and checking that the offset lag for each partition is not growing indefinitely:

bin/kafka-run-class.sh kafka.tools.ConsumerOffsetChecker --zkconnect zookeeperhost:2181 --group mirrormaker

There is a possibility of data loss when using the MirrorMaker – in the case where the producer is unable to produce messages and the consumer is still able to consume. This could occur if there were a network outage which only affected the producer. In this scenario, the consumer will continue to consume messages and commit offsets. This will likely be for a short period of time as the MirrorMaker exits upon an exception in either the consumer or producer threads, but those messages consumed and not produced are lost. There is a plan to address this issue which has been accepted for the next Kafka release.

There are a few settings that can be tweaked, such as the number of consumer and producer threads, the number of MirrorMaker processes and the properties for both the consumer and producer. In the producer properties, the queue.enqueue.timeout.ms should be set to -1 to cause the producer to block indefinitely if its queue queue is full – this can help to prevent data loss in the scenario described above. I ran some tests to investigate how the configuration affects the mirroring throughput. In these tests, the MirrorMaker processes ran in the target datacenter – which seems a sensible choice given the data-loss scenario. Failure between consuming and producing should be less likely if the cross-datacenter network transfer has already taken place before producing takes place. Here were the results:

Processes Consumer Threads Producer Threads Maximum Throughput
1 6 2 6 MB/s
1 12 2 10 MB/s
1 18 2 10 MB/s
2 12 2 14 MB/s
2 12 4 19 MB/s
3 12 6 24 MB/s
3 12 8 29 MB/s

In this investigation, the source topic had 12 partitions and we found that for maximum parallelism, the total number of consumer threads across all mirroring processes should add up to the total number of partitions. Since partitions are the unit of parallelism in Kafka, this rule applies to any type of Kafka consumer. We found that if the number of producer threads too low, this can be a bottleneck – this is shown by the difference in throughput between the fourth and fifth tests. We can also see that throughput scales fairly linearly with the number of MirrorMaker processes and consumer threads.

In conclusion, the MirrorMaker tool is a convenient solution to dealing with multiple Kafka clusters in different physical locations, when you want all data to be mirrored to a ‘main’ Kafka cluster. The number of MirrorMaker processes should be high enough to handle failure and the number of consumer and producer threads within these processes can be tweaked to achieve a target throughput. There is a data-loss scenario in the current version of MirrorMaker, but the probability of data-loss can be minimised by running MirrorMaker in the target datacenter.

Real-Time Analytics with Elasticsearch

When you are running a website used by thousands of people, it should go without saying that very valuable data can be collected about your users and they way they interact with your site. This usually comes in the form of click-stream data – which is effectively logs written by your webserver on every interaction (or click) made by a user who is navigating your site. An e-retailer can use this data for a many purposes, for example: analysing how users interact with the site and what causes them to place an order, monitoring the performance of a new advertising campaign, seeing how users respond to a new feature and detecting problems such as pages which result in an error 404. For many of these purposes, raw data can be crunched through a batch processing system such as Hadoop, but for some purposes it is beneficial have real-time information and statistics about how users are interacting with the site right now.

Imagine you are in e-retailer in the process of rolling out a brand new feature, such an improved search engine. As soon as this feature goes live, it will have an immediate impact on the user experience and the products people are interacting with. It may even change the way people search and the terms they search for. Having real-time statistics such as the number of page views, searches, product visits from searches and product orders from searches gives confidence that the new experience is having a positive impact, or at least not causing any serious problems. This article discusses our experience with building a data store to persist and query over click-stream data in real-time.

For the backing datastore of our analytics framework there were a huge number of possible solutions. We began by considering SQL, but as we are dealing with millions of click-stream events every day SQL can quickly become an expensive and not-so-scalable option. Ultimately we made a choice between MongoDB and Elasticsearch. Both are open source, distributed NoSQL document stores – Elasticsearch is built on top of Apache Lucene (a high performance JVM based search engine) and MongoDB is written entirely in C++. Elasticsearch provides a very clean and compact RESTful API which enables you to use JSON over HTTP to specify your configuration, index documents and perform queries. We found that the query API provided by Elasticsearch provides considerably more flexibility when it comes to faceting and search. An example of this is when you want to calculate a count, total or average and see how it changes over time. For instance, if we want to count the number of searches performed on our site by hour, the date histogram facet makes this easy. The following Elasticsearch query will return a set of key value pairs for each site, where the key is an hourly timestamp and the value is a count of search events:

{
  "query": {
    "match": {
      "eventType": "search"
    }
  },
  "facets": {
    "siteId": {
      "date_histogram": {
        "field": "timestamp",
        "interval": "hour"
      }
    }
  }
}

Doing this kind of aggregation with MongoDB is of course possible, but we found these queries are simply quicker and easier to write with Elasticsearch. Plus the API makes it very easy to query the store with a REST client. Of course there are advantages to using MongoDB – for instance at the time of writing there is far more documentation available, MongoDB provides more flexibility as the document structure can be changed at any time and also MongoDB is particularly good at facilitating backup and recovery. Since we were not looking for a primary data store, these advantages didn’t outweigh Elasticsearch’s cleaner API.

One of the first decisions to make when using Elasticsearch is how to structure your indices. In our case, we wanted to capture several different types of events, each of which would have different associated attributes. Page visits, searches, basket adds among other events are all logged by our web servers in real-time. This data then needs to be sent to Elasticsearch and indexed. We decided to use time-based Elasticsearch indices. This means that every day, a new index is created and all data for that day is stored within that index. The index name takes the format ‘EVENT_TYPE-YYYYMMDD’. There are a few advantages to doing this:

  • It’s easy to query over only the events and days we want. Elasticsearch supports wildcards matching for the index name – so if we send a query to ‘searches-201401*’ our query will be executed over all the search events which took place in January.
  • When we want to delete old data, we simply need to delete old indices. Clearing out old data can then be done easily and automatically using a daily cron job. No need to use time-based indices, which could add significant overhead.
  • Routing and sharding can be configured on a per index basis. This makes it possible for us to configure which servers should handle which days. For example, if a server is running out of disk space, we can just configure shards for future indices to avoid that server.
  • Using Elasticsearch templates, we can configure a mapping and settings which are automatically applied to new indices. For example, any index created with a name matching ‘searches-*’ will have a specific mapping and settings applied to it.

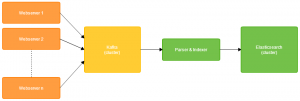
With a good idea of how the data store would be structured, the next step was to get data from our web logs into Elasticsearch, in real-time. This process involves aggregating log files, and then parsing and indexing the log events into Elasticsearch documents. We developed a Java application to serve this purpose – sending bulk updates to our Elasticsearch cluster every few seconds. The simplified data pipeline is pictured below, although we have since replaced log aggregation with Kafka, a distributed messaging framework.

The flow of data from web servers to Elasticsearch

We soon encountered some difficulties when writing queries over our data. One of the biggest difficulties comes when running queries over multiple indices. Each of our event types has different attributes, for example: search terms and search engine information appear on search events, but not on product visit events. What if we want to count the number of product visits resulting from searches for the term ‘xbox’? Well, we want to perform a ‘join’ operation, something which would be quite easy to achieve in SQL:

SELECT * FROM product_visits p INNER JOIN searches s ON (p.userId = s.userId) WHERE p.referrer_url = s.url AND s.term = 'xbox'

With Elasticsearch, things are not so simple. We can easily query several indices at once, but how can we specify that we want to find all product visit documents which have a matching search document?

Solution 1: Use parent child relationships
Elasticsearch enables us to specify a parent child relationship between document types. For instance, we could have two types of document: product_interaction documents (which contain event types product_visit and product_order) and cause documents (which contain event types like search). We could then configure a parent-child relationship between causes and product_interactions, such that each product_interaction is the child of a single cause. This structure enables us to use the built in ‘has_parent’ query to find all product visits that resulted from a specific search:

POST searches-201401*/_search

{
  "query": {
    "has_parent": {
      "parent_type": "cause",
      "query": {
        "match": {
          "searchTerm": "xbox"
        }
      }
    }
  }
}

This solution is flexible. The two document types are completely independent of each other – if we want, we can update one without affecting the other. To aid performance, Elasticsearch ensures that children are physically stored in the same shard as their parent. However there is still a performance cost to using the parent child relation and we found that our query speed sometimes suffered. There is also a big limitation to this design – there is no support for more complex relationships, such as grandparent->parent->child. So, we would be unable to add further relationships (e.g. between product_orders and product_interactions) and model the full chain of events.

Solution 2: Add extra information at indexing time
Our end solution which solves both of the above problems is simply to move the logic surrounding relationships into the application layer. State corresponding to recent user activity (for example, searches in the last ten minutes) are stored in memory in our indexing application. Then, when product visit events are received, the in-memory state is checked and the ’cause’ of the product visit can be found. Then, when indexing the product visit document, extra attributes are indexed within the document such as the search terms which led to the product being visited. If we want to track more events in the train, such as product orders, then attributes that were added to the product visit document are copied into the product order document. This means that at query time, we don’t need to search over multiple document types and perform a join – all the information we need is contained in a single document type. This solution gives us very fast query performance at the cost of higher storage and memory requirements – since document size is greater and some information is duplicated.

With this setup, we are able to comfortably query over a month’s worth of data within just a couple of seconds – and that’s with a single node cluster. One problem we encountered is that it is possible to write incorrect or very computationally demanding queries and no matter how complex or demanding the query, Elasticsearch will attempt the computation. If it does not have sufficient resources to complete the query it will fail with an OutOfMemory error and the only way to recover from this is to restart Elasticsearch on the failed node(s). Aside from this, our experience with Elasticsearch for near real-time analytics has been very positive.